Go with the Flow - Make the most of this powerful technique
Discover all the ways flow cytometry can be used to take your research further
Content:
Introduction:
Flow cytometry is a laser-based technology offering an abundance of applications in immunology, molecular biology, microbiology, cancer and infectious diseases. Flow cytometry allows the analysis of single cells as they pass through a fluidic system and are exposed to lasers. Flow cytometry uses scattered and fluorescent light to rapidly detect size and granularity (complexity) of cells or small particles. The significant increase in the number of fluorochromes, fluorescent proteins, and tandem and polymer dyes available, plus increasingly sophisticated cytometers with upward of five lasers, has allowed the design of 30+ parameter panels.
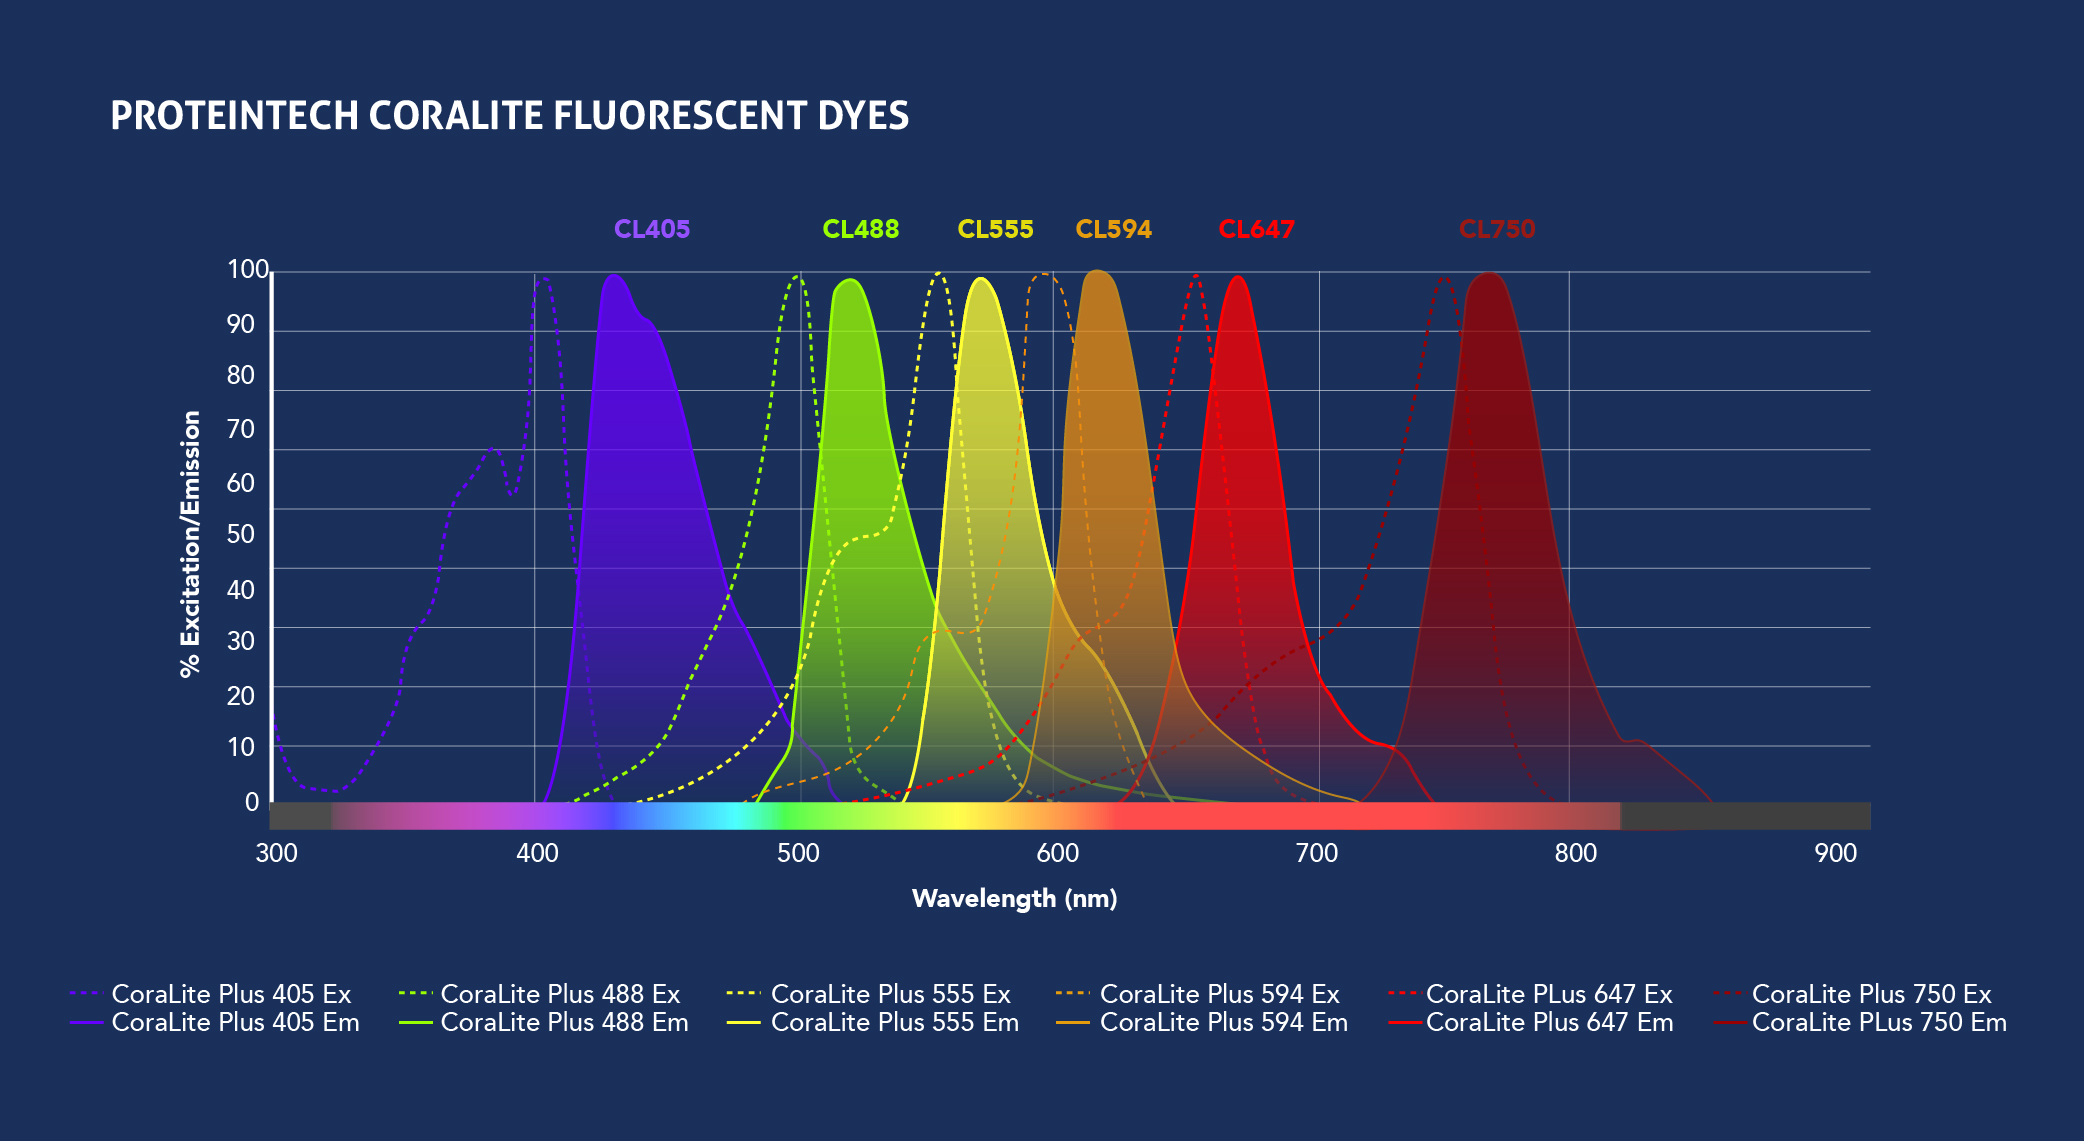
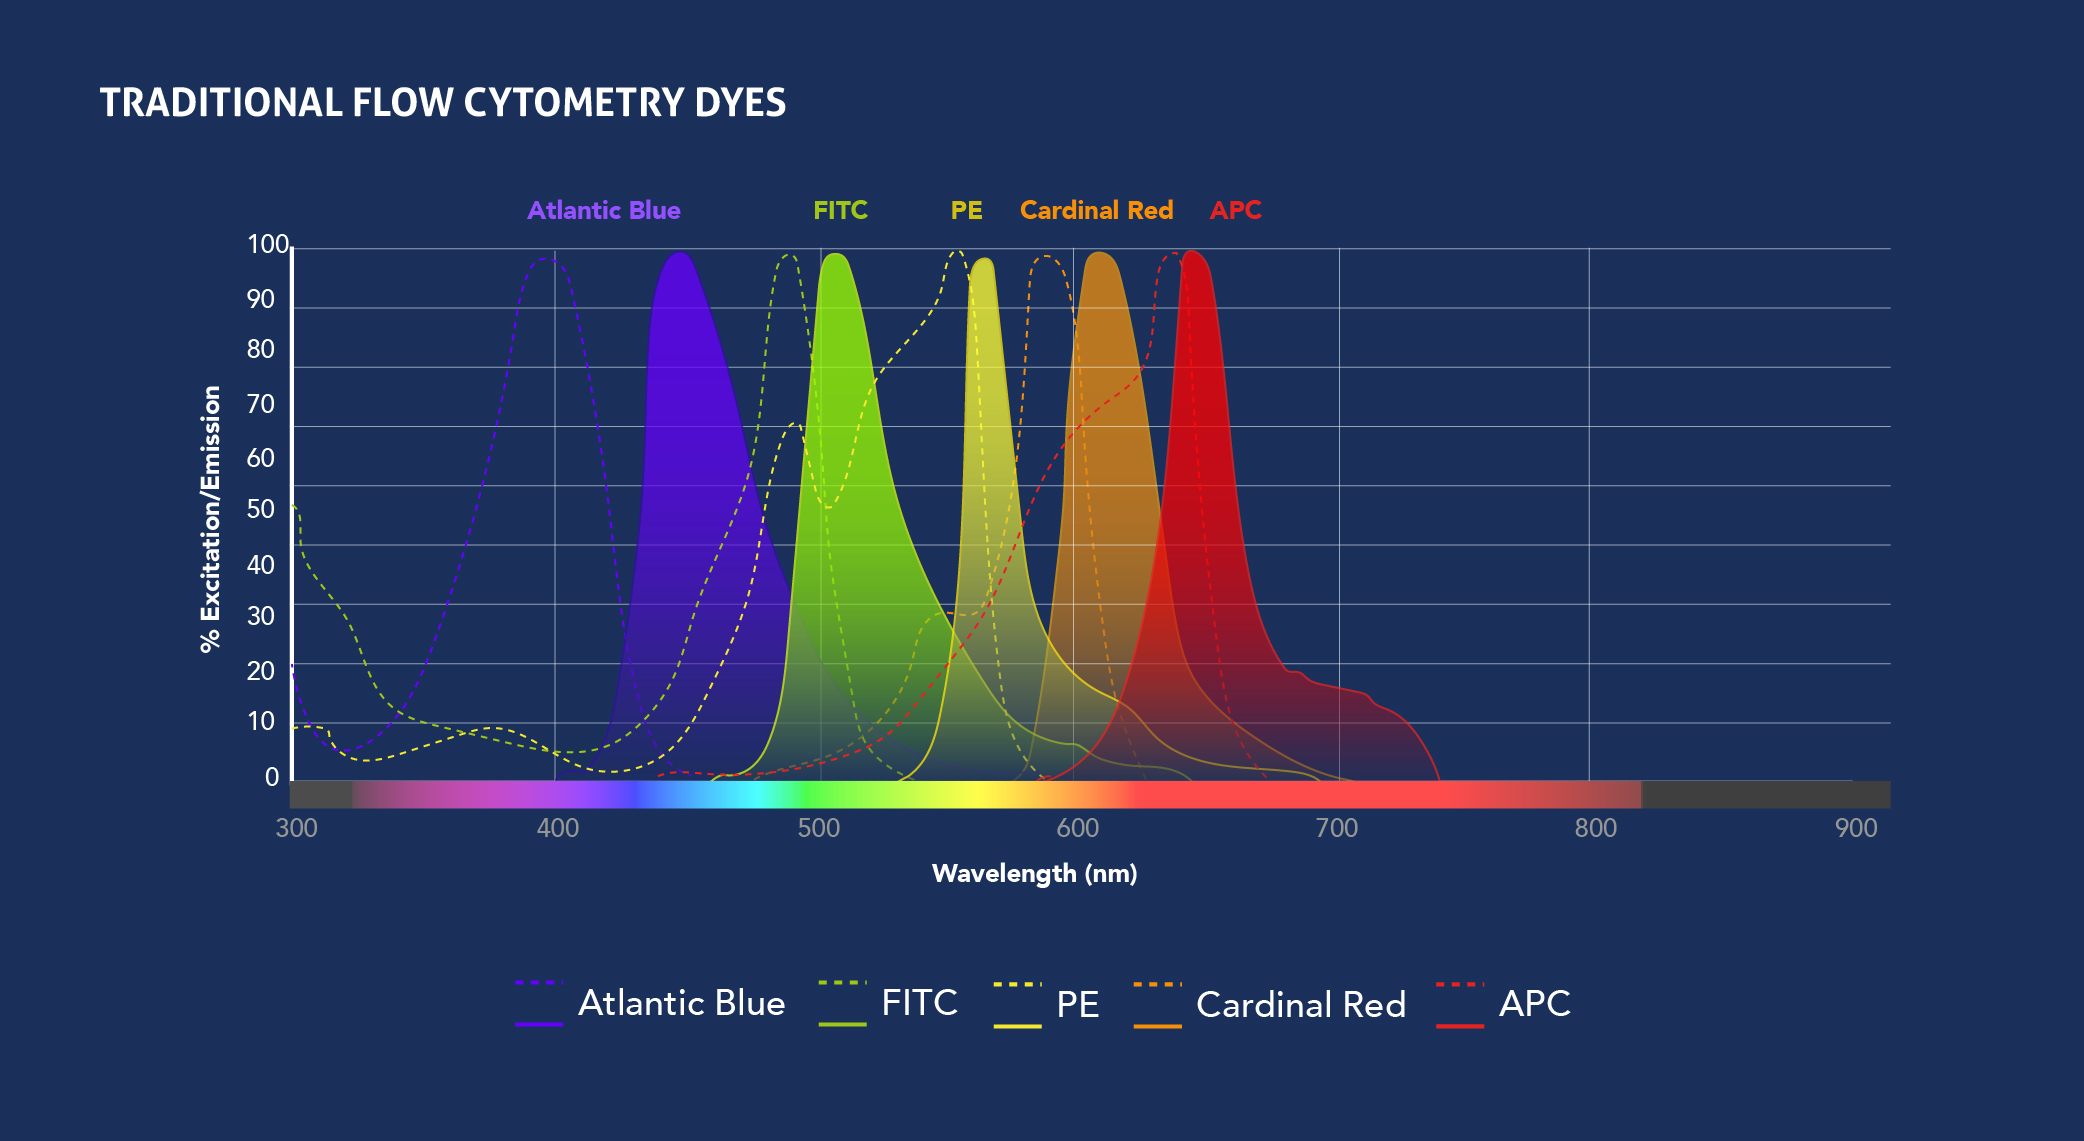
Fig.1: Spectra View of Proteintech’s CoraLite fluorophores (top) and Traditional fluorophores (bottom) excitation and emission wavelengths. Check out the Spectra Viewer tool to design your panel.
Interpreting Flow Data:
Flow cytometry data is usually interpreted in three main ways
1. Forward and Side Light Scatter:
This represents the light scatter as it passes through the cells and gives information on the size and complexity of the cells. Forward scatter (FSC) and side scatter (SSC) are used to gate out (remove from analysis) unwanted events such as dead cells or doublets (when two cells pass together but the cytometer counts it as a single event). In samples with known cells present (e.g. blood, spleen, bone marrow), certain cell types can be identified from their FSC/SSC, such as monocytes, lymphocytes or granulocytes.
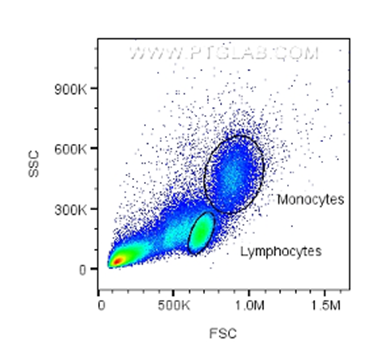 Fig.2: FSC/SSC plot with gating for monocytes and lymphocytes based on size and granularity
2. Density Plots
Also known as bivariate scatter plots, density plots display the expression of two fluorophores/markers simultaneously. Single dots in the colour of a heatmap represent the individual cells (or 'events'), with density represented using the colours of a heatmap with yellow/red for high density and blue/green for lower density; this allows clear visualization and segregation of the sub-populations. The density plots are divided into four quadrants to divide expression of markers: double positive (top right), double negative (bottom left), marker 1 (x-axis), positive marker 2 (y-axis) negative (bottom right), marker 1 negative marker 2 positive (top left) – see example below.
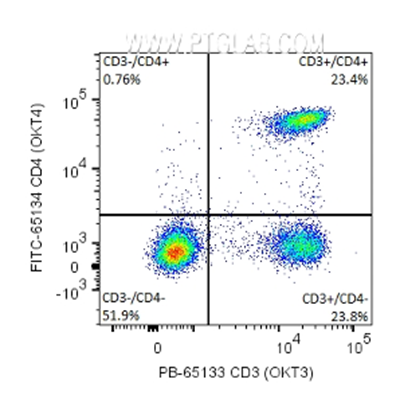 Fig.3:1x10^6 human peripheral blood mononuclear cells (PBMCs) were surface stained with 5 μl PB Anti-Human CD3 (PB-65133, Clone: OKT3) and 5μl FITC Anti-Human CD4 (FITC-65134, Clone: OKT4). Cells were not fixed. Lymphocytes were gated.
3. Histograms
Histograms present single parameter fluorescence of cells. This is represented as two peaks (negative and positive) and is used for gating or adjusting the voltage on your cytometer when setting up. Ideally, voltage is adjusted to separate the peaks as much as possible within the wavelength range to best segregate between negative and positive populations (see below for example).
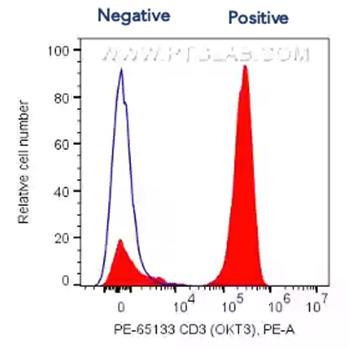 Fig.4 1X10^6 human PBMCs were surface stained with 5 ul PE Anti-Human CD3 (PE-65133, Clone: OKT3, red filled) or Mouse IgG2a Isotype Control (blue line). Cells were not fixed. Lymphocytes were gated.

We have summarized below the main applications of Flow Cytometry
Immunophenotyping
This has become the most common use of flow cytometry, allowing for the simultaneous immune profiling of blood, bone marrow, and any tissue dissociated into a single cell suspension such as lymph nodes, spleen, or tumors. There are now well characterised markers for immune cells, which have greatly expanded the fields of immunology and immuno-oncology. Antibodies and cytometers have high sensitivity, enabling the detection of populations with very few cells.
Below is an example of immunophenotyping of isolated human PBMCs. This can indicate the proportion of immune cell populations in the patient’s circulation. This information can reflect an immune response or a change in a specific cell type, which can point towards a disease mechanism or treatment response. The proportion of the specific immune cells can be compared with healthy ranges or across treatments groups.
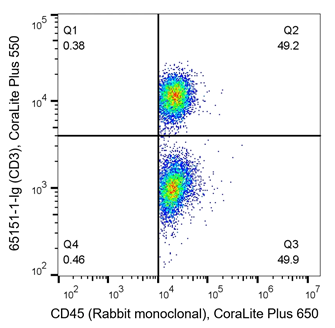
T cells are key players of the adaptive immune response and are often analyzed during immunophenotyping. CD3 is a marker for all T cells, CD4 is specific to helper T cells and CD8 is expressed on cytotoxic T cells. T cells are of haematopoietic origin, and therefore also express the CD45 marker. The density plots below are an example of immunophenotyping of T cells. In the left panel, PBMCs have been co-stained with CD45 (x-axis, haematopoietic stem cell (HSC) marker) and CD3 (y-axis, T cell marker). Q2 represents CD45+ CD3+ co-expressing cells, which are T cells. Q3 represents CD45+CD3- cells, the rest of the HSC population. From this, data shows roughly half of this sample are T cells (Q2 – 49.2%). In the right panel, cells are co-stained with CD3 and CD4. The density plot indicates 33.1% of cells (Q14) are helper T cells (CD3+CD4+), whilst 20.6% (Q13) are another subtype of T cell as they still express CD3. CD3-CD4- (Q16) represent the rest of the cells in the sample, likely other immune cells.
 |
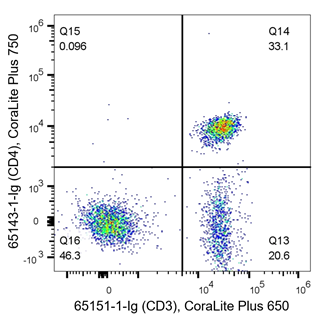 |
Fig 5: Flow cytometry of PBMC. 1x10^6 human PBMCs were stained with (left) anti-CD45 labeled with FlexAble CoraLite Plus 650 Kit (KFA003) and anti-CD3 (clone UCHT1, 65151-1-Ig) labeled with FlexAble CoraLite Plus 550 Kit (KFA022). (right) anti-CD3 (clone UCHT1, 65151-1-Ig) labeled with FlexAble CoraLite Plus 650 Kit (KFA023) and anti-CD4 (clone RPA-T4, 65143-1-Ig) labeled with FlexAble CoraLite Plus 750 Kit (KFA024)
Cell Sorting
Cell sorting is the isolation of a cell population using fluorescent markers, also known as Fluorescent Activated Cell Sorting (FACS). This includes the isolation of circulating tumor cells (CTCs) from blood (see table with flow markers for the isolation of CTCs by cancer type), the selection of cells transfected with a fluorescent vector, or isolation of a specific immune cell population. Further downstream applications of the sorted cells include cell culture, RNA-sequencing, and proteomic or metabolite analysis.
Cell Cycle Analysis
Cell cycle analysis was one of the earliest applications of flow cytometry. It uses fluorescently labelled DNA probes that bind stoichiometrically to DNA (proportionally to the total amount of DNA present per cell) which can be correlated to the cell cycle stage. Propidium Iodide (PI) or DAPI (4',6-diamidino-2-phenylindole) are often used for this. Cell cycle analysis is typically used when working with a homogenous cell population (e.g. an immortalised cell line) to investigate drug effects.
Cell Proliferation
There are multiple ways to measure cell proliferation through flow cytometry, for example, the integration of thymidine analogues (BrdU/EdU) into replicating DNA. The cells are pulsed with the analogues for up to 6h before being fixed, permeabilized and stained for the incorporated base pairs. Another method uses dyes such as Carboxyfluorescein succinimidyl ester (CFSE), which can penetrate the cell membrane and bind covalently to intracellular structures (e.g. lysine). This is inherited in the daughter cell population after replication. This method allows the tracking of proliferation through several generations. Proliferation can also be quantified through the expression of proliferation antigens such as Ki67 or PCNA.
Cell Viability
Cell viability is often included in combination with other flow applications such as immunophenotyping to ensure gating and analysis of live cells only. DNA-binding dyes used for cell cycle analysis can be used for viability; however, only with unfixed cells. Amine-binding viability dyes, such as Proteintech’s Phantom Dyes, can also be used to assess the viability of fixed samples. These can penetrate the compromised membrane of dead cells and bind to intracellular amine groups on proteins. Consequently, these are expressed at a significantly higher level in dead cells and live/dead cells can then be easily discriminated. Read our blog post for more detail about selecting the correct viability dye for your sample.
Cell Death
Cells can die via several pathways, either in an uncontrolled way by necrosis or by programmed cell death such as apoptosis, necroptosis, pyroptosis or ferroptosis.
Apoptosis is widely studied by flow cytometry, using markers such as Annexin V, which bind to phosphotidyl serine (PS) as it is translocated to the extracellular side of the plasma membrane during apoptosis. The TUNEL assay uses Deoxyuridine Triphosphate (dUTP) conjugated with a fluorochrome, which is added at the ends of fragmented DNA by TdT (terminal deoxynucleotidyl transferase) during apoptosis. Apoptotic signalling requires caspase 3 and its expression can also be used to measure apoptosis and discriminate from other forms of cell death.
The TUNEL assay density plots in figure 6 show an increasing proportion of apoptotic cells across the panels left to right. The red box delineates the threshold for excitation of the CoraLite 594 fluorophore conjugated to the dUTPs. If the cells are undergoing apoptosis, they accumulate dUTP bound to fragmented DNA, increasing fluorescence until reaching the threshold. These apoptotic events are then visible on the density plot as fluorescence.
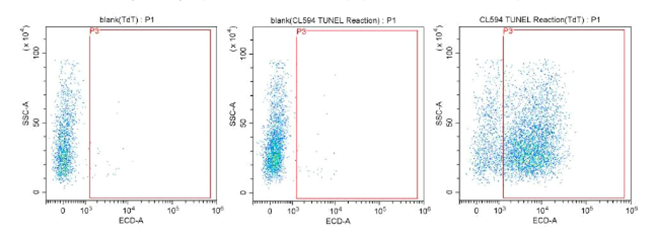
Fig.6: CoraLite®594 TUNEL Assay Apoptosis Detection Kit PF00009.
The above experimental results are based on Jurkat cells cultured for three days to perform a flow cytometry experiment to detect the apoptotic cells in the cell sample.
Kits such as Proteintech’s CoraLite® 488-Annexin V and PI apoptosis kit can be used to simultaneously assess viability and apoptosis. This kit allows you to distinguish between early or late apoptotic cells from necrotic cells. Early apoptotic cells have an intact plasma membrane but express PS extracellularly, preventing PI dye from penetrating the cell but enabling Annexin V binding. Necrotic cells however have a compromised membrane allowing PI entry and DNA binding. Early apoptotic cells are PI-/Annexin V+, late apoptotic cells will have a damaged membrane and are PI+/Annexin V+, necrotic cells are PI+/Annexin V-, and live cells are PI-/Annexin V- (see flow cytometry quadrants below). Read the cell viability protocol for more detail.
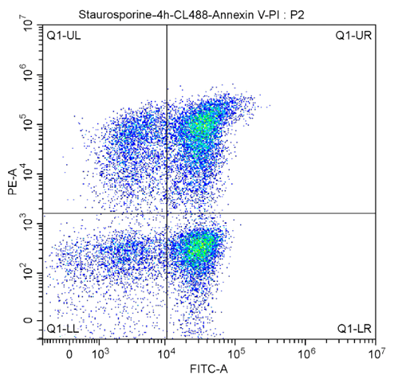
Fig.7: CoraLite®488-Annexin V and PI Apoptosis Kit PF00005. The cell population was analyzed in THE SSC/FSC diagram:
FITC-A was selected on the X-axis to denote CL488-AnnexinV. The Y-axis is represented by PE-A.
The meanings of the regions in the figure above:
Q1-UL (CL488-AnnexinV)-/PI+, cells in this region are necrotic. There may also be a small number of late apoptotic cells in it, even those with mechanical damage.
Q1-UR :(cl488-annexinv)+/PI+, cells in this region are late apoptotic cells.
Q1-LR :(cl488-annexinv)+/PI-, cells in this region are early apoptotic cells.
Q1-LL :(cl488-annexinv)-/PI-, cells in this region are living cells.
The apoptosis rate is usually calculated using Q1-UR+Q1-LR, late apoptosis + early apoptosis group (i.e., all AnnexinV-positive groups).
Necroptosis is an alternative form of programmed cell death that is used by cells in response to infection by pathogens that inhibit apoptosis. It combines elements of apoptosis with regulated intracellular signalling using RIP3 and MLKL and necrosis, with the leakage of cell contents via pores in the plasma membrane. Contrarily to apoptosis, necroptosis is not an immunologically silent cell death and promotes inflammation. It functions in a caspase-independent manner but can be detected by flow cytometry via caspase 3-/RIP3+ gating.
Phagocytosis Assay
Phagocytosis can be quantified using flow cytometry by infecting the cells of interest with a bacteria labelled with a pH sensitive dye that fluoresces once in the acidic environment of the phagosome.
Intracellular Cytokine Staining (ICS)
ICS is used as an ex vivo quantification of immune cell activation, often applied to T cells. As cytokines are secreted molecules, cells are first treated with a protein transport inhibitor such as Brefeldin A to block cytokine secretion and enable intracellular detection. The cells can then be probed with cytokine-specific antibodies. This offers a multi-parameter approach to immune monitoring, determining immune cell types by surface markers as well as cytokines produced. In patient samples, this has the advantage of only requiring a small amount of blood for flow cytometry analysis. This can be applied to the analysis of cytokines such as Interferon (IFN gamma).
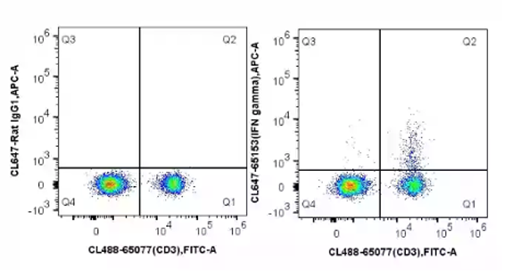 Fig.8: C57BL/6 mouse splenocytes were stimulated with PMA and Ionomycin (4h) in the presence of protein transport inhibitors, stained with CoraLite®488 Anti-Mouse CD3 (CL488-65077, Clone: 17A2) and then fixed with 4% PFA and permeabilized with Flow Cytometry Perm Buffer (PF00011-C). Cells were then stained with CoraLite®647 Rat IgG1 isotype control (left) or 5 ul CoraLite®647 Anti-Mouse IFN gamma (CL647-65153, Clone: XMG1.2) (right).
Intracellular Calcium Flux
Calcium ions are central signal transducers in cells and their homeostasis controls cell function. Dysregulated calcium homeostasis is linked with many diseases. Flow cytometry can be used to measure intracellular calcium flux. Dyes such as indo-1 undergo a colour shift when bound to calcium and this allows quantification of intracellular calcium concentration.
High Throughput Screening
In the pharmaceutical industry, flow cytometry can be used for HTS of mutants from CRISPR libraries or random mutagenesis. Using surface display systems on yeast and bacteria, screening for enzyme or antibody libraries can also be performed by flow cytometry. The significant advantage of flow cytometry over other screening methods is the possibility of sorting out the sub-population of interest and simultaneously performing multi-parameter analysis.
Check out our Flow Cytometry Resources page for more help and info.
Blog written by Lucie Reboud, Intern at Proteintech, PhD student in cancer research at the University of Manchester.
References:
McKinnon, K. M. (2018). Flow cytometry: an overview. Current protocols in immunology, 120(1), 5-1.
Dhuriya, Y. K., & Sharma, D. (2018). Necroptosis: a regulated inflammatory mode of cell death. Journal of neuroinflammation, 15(1), 1-9.
Vitelli, M., Budman, H., Pritzker, M., & Tamer, M. (2021). Applications of flow cytometry sorting in the pharmaceutical industry: A review. Biotechnology Progress, 37(4), e3146.
Related Content
Ask a Flow Cytometry expert: your questions answers
Support
Newsletter Signup
Stay up-to-date with our latest news and events. New to Proteintech? Get 10% off your first order when you sign up.