Live Cell Imaging
Live-cell imaging allows the visualization of cellular processes using time-lapse microscopy. Structural changes and physiological processes can be observed in real-time. Other common microscopy techniques such as immunofluorescence usually require cell fixation and permeabilization, which shows only a snapshot of the cells at a certain timepoint and might lead to artefacts. In contrast, during live-cell imaging, dynamic changes can be analyzed, particularly, when subcellular structures are being investigated.
Chromobodies
Chromobodies are fluorescent nanoprobes for real-time, live-cell imaging of endogenous proteins. These Nanobodies, fused to a fluorescent protein (GFP or RFP), are expressed inside the cell and can bind to target proteins, marking them with fluorescence. They are compatible with various eukaryotic cells, from plants to vertebrates. Chromobodies can be introduced via transient transfection or used in stable cell lines and transgenic organisms with constitutive or responsive expression.
-

Non-invasive: Intracellular expression
-
Compatible with many host species
Immuno-Oncology VHHs New
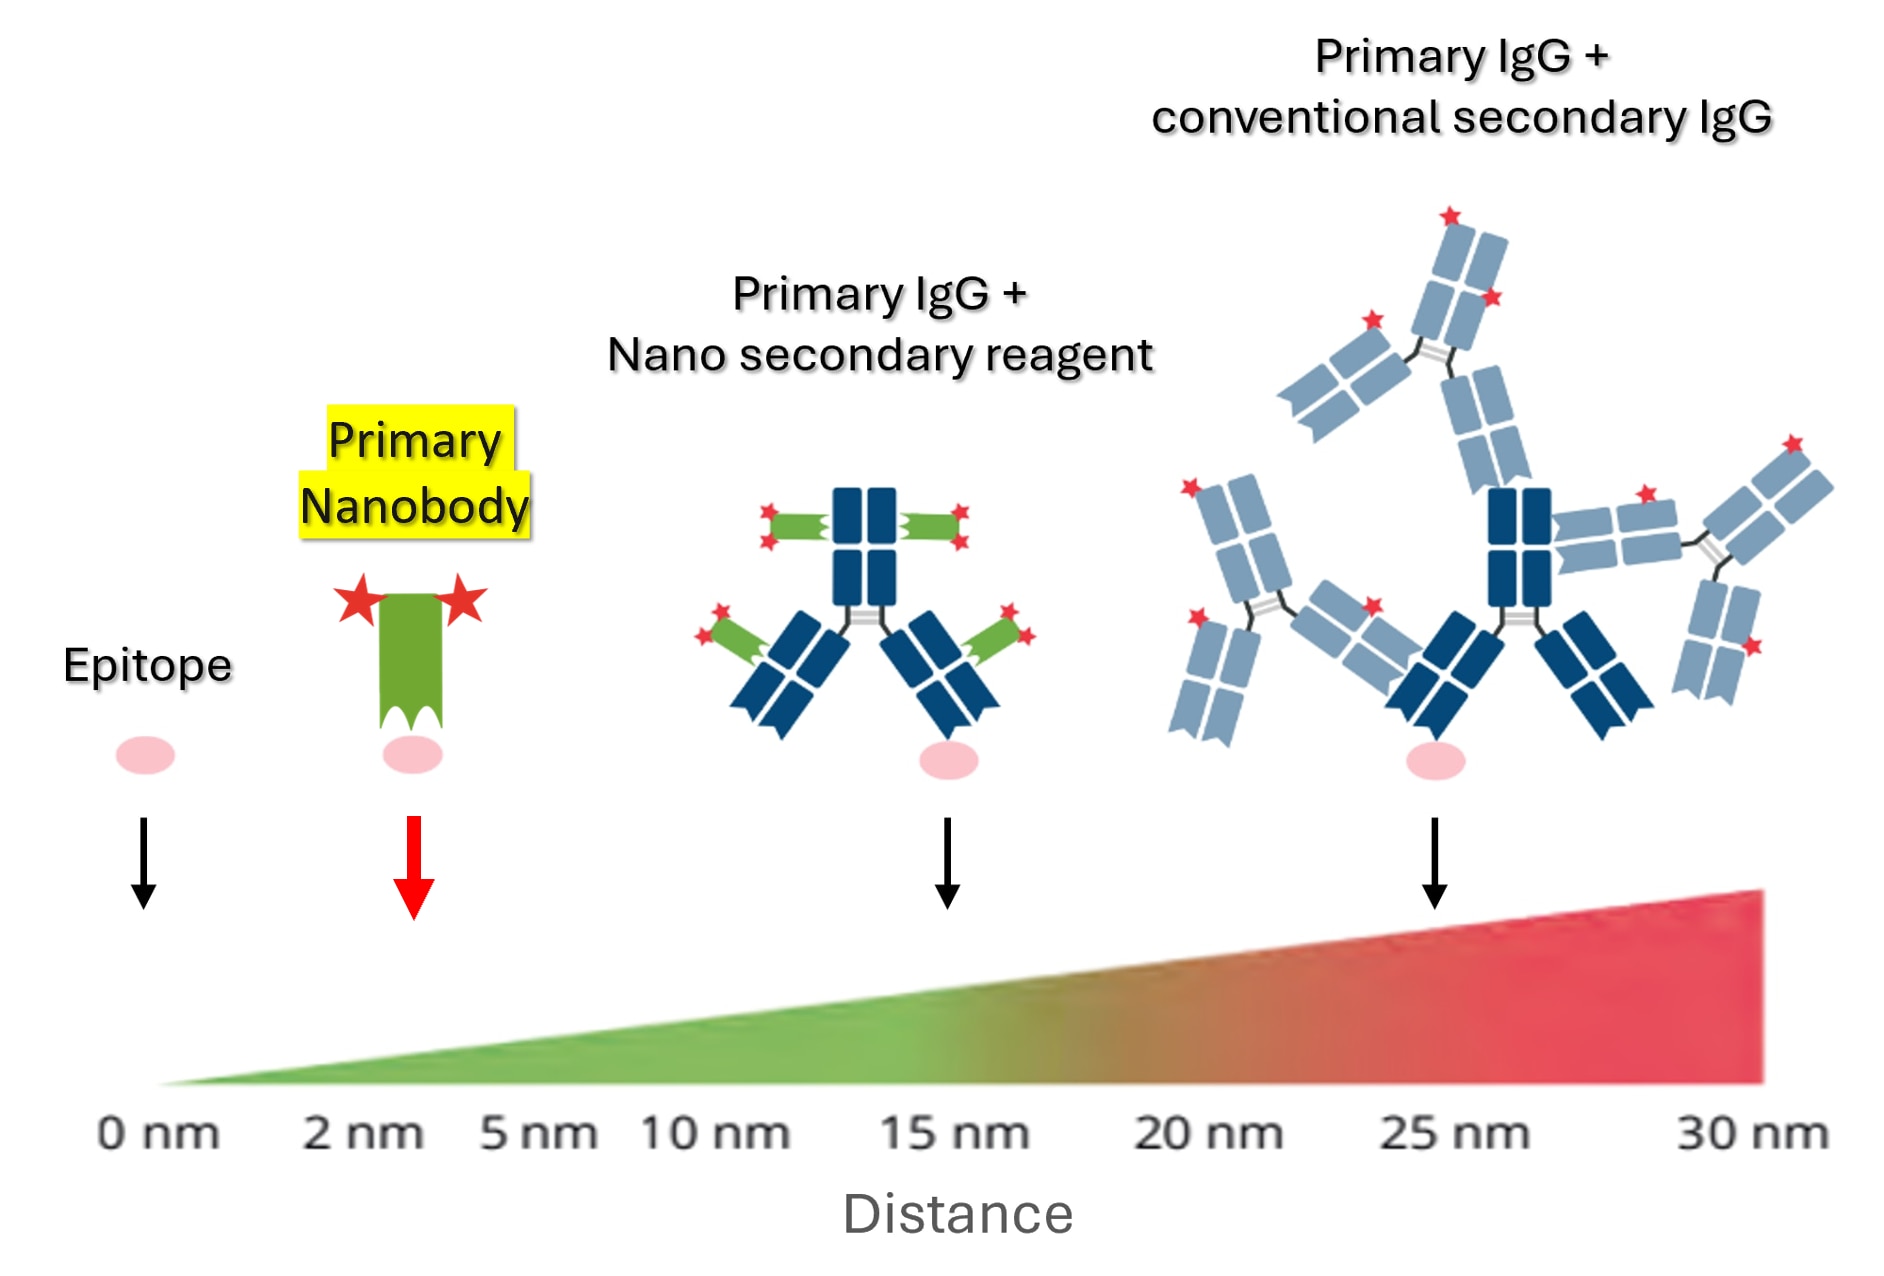
Our Immuno-Oncology VHHs are monovalent Nanobodies that are targeted against the most important immune oncology targets like PD-1, PD-L1, TIGIT etc.. They are optimal tools for IF, SRM, Flow, but due to their small size also live cell imaging. Their monovalent nature helps avoiding potential experimental bias through clustering effects. A minimal epitope-label displacement is another important benefit when working with Nanobodies, resulting in sharper images with less diffuse fluorescent signal.
-
Minimal epitope label displacement
-
No receptor crosslinking with monovalent binding
| Target | Conjugates | Applications | ||
|---|---|---|---|---|
| CTLA4 | CoraLite® Plus 555 | CoraLite® Plus 647 | FITC | IF, Live Cell Imaging, FC |
| FLT3 | CoraLite® Plus 555 | CoraLite® Plus 647 | FITC | IF, Live Cell Imaging, FC |
| LAG3 | CoraLite® Plus 555 | CoraLite® Plus 647 | FITC | IF, Live Cell Imaging, FC |
| MSLN | CoraLite® Plus 555 | CoraLite® Plus 647 | FITC | IF, Live Cell Imaging, FC |
| PD-1 | CoraLite® Plus 555 | CoraLite® Plus 647 | FITC | FC |
| PD-L1 | CoraLite® Plus 555 | CoraLite® Plus 647 | FITC | IF, Live Cell Imaging, FC |
| TIM3 | CoraLite® Plus 555 | CoraLite® Plus 647 | FITC | IF, Live Cell Imaging, FC |
| TIGIT | CoraLite® Plus 555 | CoraLite® Plus 647 | FITC | IF, Live Cell Imaging, FC |
| Target | Format | ||
|---|---|---|---|
| Actin | TagGFP2 | TagRFP | Sold in plasmid format; MTA required |
| Cell Cycle Chromobody | TagRFP | Sold in plasmid format; MTA required | |
| DNMT1 Chromobody | TagGFP2 | TagRFP | Sold in plasmid format; MTA required |
| Histone Chromobody | EGFP | Sold in plasmid format; MTA required | |
| Lamin Chromobody | TagGFP2 | Sold in plasmid format; MTA required | |
| mNeonGreen Chromobody | mCherry | Sold in plasmid format; MTA required | |
| Nuclear Actin | TagGFP | Sold in plasmid format; MTA required | |
| PARP1 Chromobody | TagGFP | TagRFP | Sold in plasmid format; MTA required |
| Vimentin Chromobody | TagGFP | Sold in plasmid format; MTA required | |
Time-lapse imaging of TIM3 internalization, detected with CoraLite® Plus 647-conjugated TIM3 VHH (magenta). CHO cells stably co-expressing TIM3 and GFP (green) were live immunostained with CoraLite® Plus 647-conjugated TIM3 VHH and imaged for 0.5 hours at 37C.
Time-lapse imaging of TIGIT internalization, detected with CoraLite® Plus 647-conjugated TIGIT VHH (magenta). CHO cells stably co-expressing TIGIT and GFP (green) were live immunostained with anti-TIGIT CoraLite® Plus 647-conjugated TIGIT VHH and imaged for 0.5 hours at 37C.
U2OS cell line expressing Lamin-Chromobody fused to the green fluorescent protein TagGFP
Live cell imaging of HeLa cells: Live cell imaging of HeLa cells stable expressing Cell Cycle-Chromobody (TagRFP). Images from a time series of 22 hours are shown.

The time lapse analysis reveals the reorganization of actin after treatment with Cytochalasin D: HeLa cells were subjected to confocal imaging upon treatment with 2 µM of Cytochalasin D for 1 hour and recovery for 4 hours. Actin Chromobody enables monitoring of actin dynamics in real-time in living cells