Flow Cytometry Gating for Beginners
A step-by-step guide to flow cytometry gating for easy analysis and clean, publication-ready data.
Written by Michelle Belmont, Scientist, MS at Proteintech Group.
You’ve run your samples; now what? Most flow cytometers allow some analysis while samples are running, as well as afterward. However, analysis software will allow for more comprehensive analysis of your FCS files and the ability to save your dot plots and histograms in a format that fits your needs.
What is gating in flow cytometry?
Gating is the process of selecting a subset of events from all events collected during a flow cytometry experiment for further analysis or data presentation. This includes general clean-up of the data, such as removing dead and dying cells or events consisting of multiple cells, as well as isolating your target cell population using their characteristic size, granularity, and expression of various cell markers. Proper gating, along with smart panel-building, can make your data easier to interpret and more publication-ready.
Gating begins relatively the same regardless of the sample used, whether it is from primary cells or a cell line. Beginning with a broad gate of your cells of interest, gating narrows the population to cells of interest – cells inside the gate are included in further analysis, while cells outside the gate are excluded. Depending on your panel, gating can also allow you to look for differences between conditions within your cells of interest. Flow cytometry is often performed to look for immune markers and function, so we will focus on that here.
Gating FSC vs. SSC
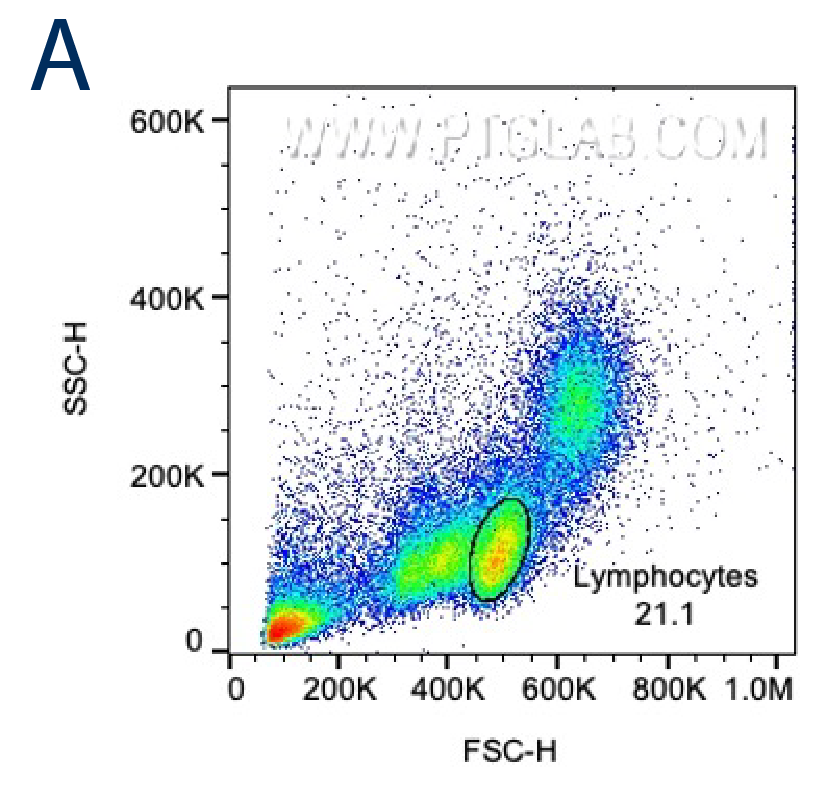
The first step to isolating your cells of interest begins with forward scatter (FSC) and side scatter (SSC). Larger, more complex cells will be higher in both parameters. Knowing the size and makeup of your cells of interest is key to gating accurately. If cell lines are being used, the FSC/SSC should show one main population of cells: this population should make up your initial gate. For primary cell analysis, such as for PBMC's, either lymphocytes, monocytes, granulocytes, or a combination of these are the initial gate on the FSC, SSC plot.
 |
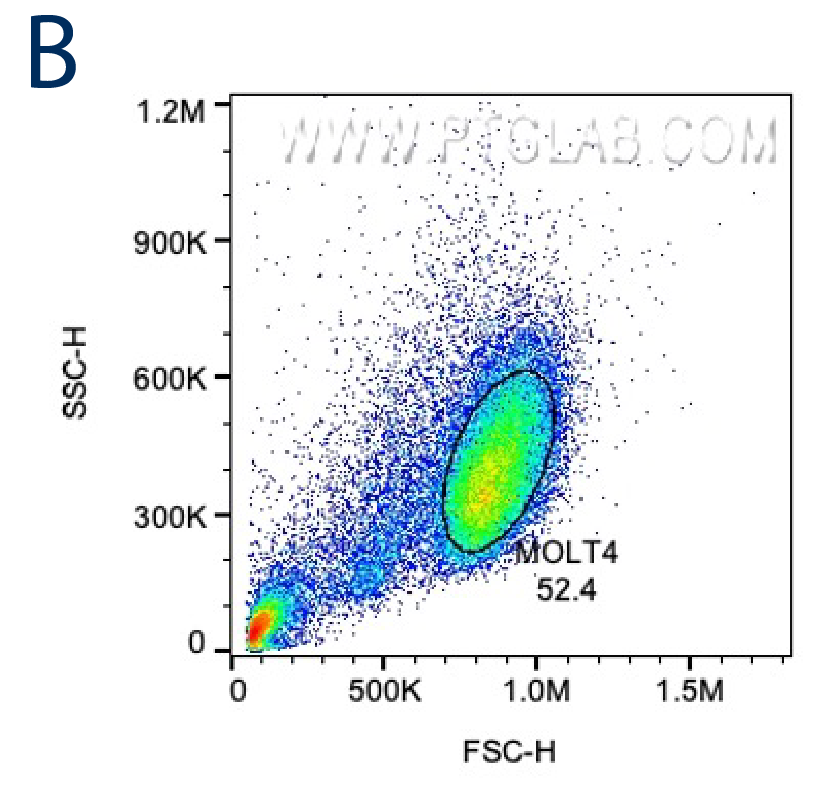 |
Figure 1. A. FSC/SSC plot of PBMCs with gating for lymphocytes based on size and granularity. 21.1% of the events collected were included in the lymphocyte gate. B. FSC/SSC plot of a cancer cell line (MOLT4). 52.4% of events were included in this initial gate.
Gating for single cells: FSC-A vs FSC-H or SSC-A vs SSC-H
Narrowing in on the cells chosen in the first gate, you would next want to exclude any clumps of multiple cells, as these can cause skewed results in your final gating. This is done by looking at FSC-A vs FSC-H (or FSC-W) or SSC-A vs SSC-H (or SSC-W); the latter is more sensitive for gating out doublets. When multiple cells are collected in a single event, the height (H) of the peak tends to be greater than the overall area (A) of the peak for that event. Width (W) can also be used for this analysis in place of height. Width and height are proportional to area for single cells, and single cells will fall on the diagonal on a plot of Area vs Height or Area vs Width, while multiples will fall outside of the diagonal line. This step can also be done prior to broad gating of cells of interest.
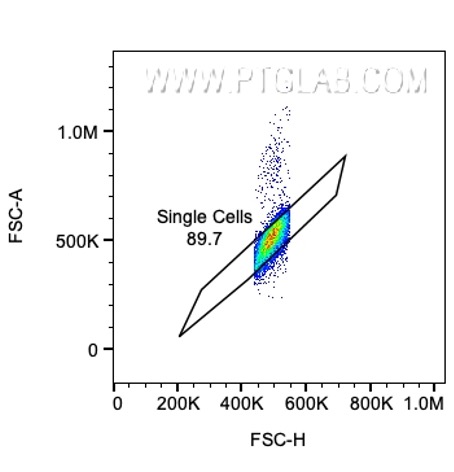
Figure 2. Gating along the diagonal for single cells in a FSC-A vs FSC-H plot.
Gating for live cells
Once single cells of interest are the only cells in your analysis, you can now gate for live cells. Dead cells can be sticky and pick up dye not specific for that cell, causing inaccurate results and false conclusions. Additionally, they often have varied areas and heights that can make data look sloppy. Depending on your panel design, you may need to be more liberal with your live cell gate since some dyes can bleed into other channels. You can always go back and adjust this gate to be more conservative if you included some dead cells or gated out some viable cells. Of course, your viability dye should not be in the same channel as any other marker in your flow panel.
For more about how to pick a viability dye, go to our To dye or not to dye blog.
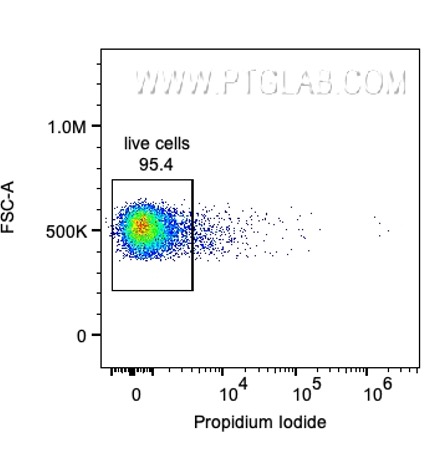
Figure 3. Gating for live cells (negative for propidium iodide).
Finding your cells of interest
Now you should have live single cells of interest, and you can begin looking at the markers in your panel. Panel design is critical for getting clear and accurate results and depends on your cells of interest. Resources, such as FluoroFinder, can aid in assigning fluorophores to the different markers in your panel.
You will want to use more broad markers first (i.e., CD45 for lymphocytes) and then narrow your cells down until you have your desired population (i.e. CD3+/CD19-/CD8+ for CD8 cytotoxic T lymphocytes). You can then analyze this specific cell population for its expression of various specialized markers. For this example, CD8 cytotoxic T lymphocytes often secrete interferon gamma (IFN-g) when activated. Adding IFN-g to your panel will thus allow you to look at IFN-g expression in your CD8 cytotoxic T lymphocytes.
There are multiple tools that you can use to change the look of your gating. Axis adjustment allows you to separate your positive and negative populations more so that gates can be applied more accurately. Additionally, large or brightly stained cells may be beyond the axis maximum based on your settings, and adjusting the minimum and maximum of the axis can bring these cells into view. You can also change the look of your dot plot through the “smoothing” tool. Both dot plots and contour plots can be colored according to the density of events. These tools can help to delineate cell populations for more accurate gating. All of these tools (gating, axis adjustments, smoothing) can also be applied to histograms, but gates drawn on a histogram cannot be viewed in dot plot format.
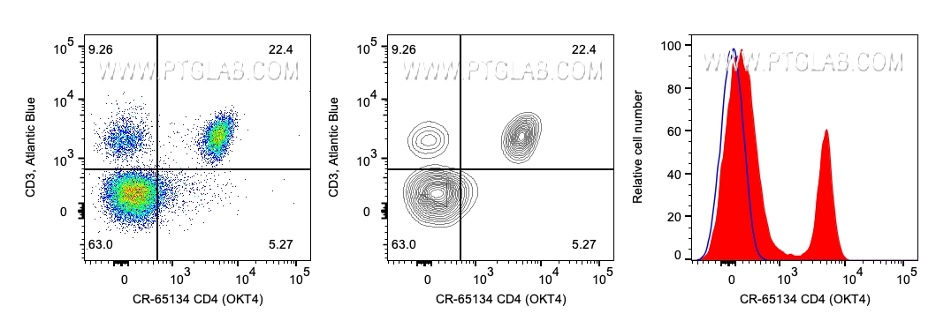
Figure 4. A. Lymphocytes stained with CD3 (y-axis) and CD4 (x-axis), viewed as a dot plot and colored to show the density of events. B. The same data is displayed as a contour-style plot. C. A histogram showing the distribution of CD4 expression in the same lymphocytes.
Once you have your desired gating on one sample, you can apply it to all samples in your workspace so that your gating is consistent and conveys accurate results. Generally, you’ll want to gate on an FMO (fluorescence minus one) control and apply those gates to your stained samples to avoid bias during analysis. When applying one gating strategy to multiple samples, you should always check to make sure no desired cells were unintentionally excluded. Gating in your FCS files can also always be adjusted to improve the clarity of your data. And just like that, you’ve completed the first step to analyzing your flow cytometry data.
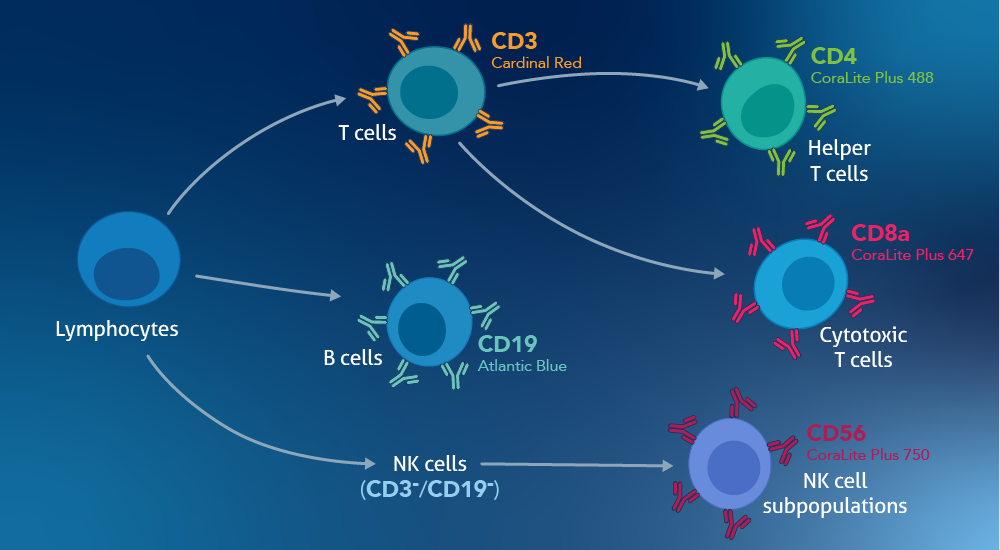
Need more help getting started? Our beginner-friendly Flow Cytometry Panels are pre-optimized to help you find your cells of interest. Each one includes 5 full-size antibodies and a comprehensive gating strategy.
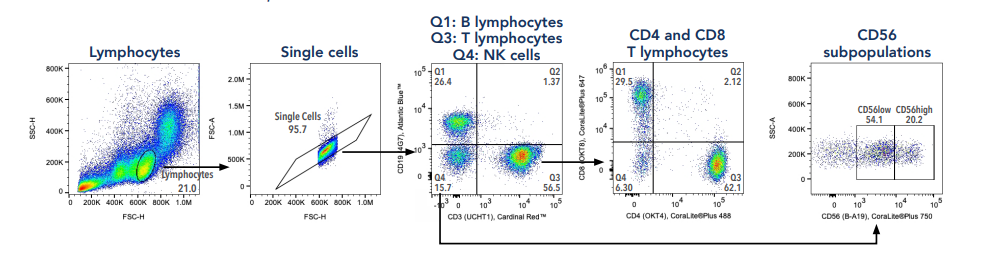
Figure 5. Targets and gating strategy to separate T cells, B cells, and NK cells from Human PBMC's using the Human TBNK Basics Panel (PK30012)

Related Content
Ask a Flow Cytometry expert: your questions answers
Support
Newsletter Signup
Stay up-to-date with our latest news and events. New to Proteintech? Get 10% off your first order when you sign up.